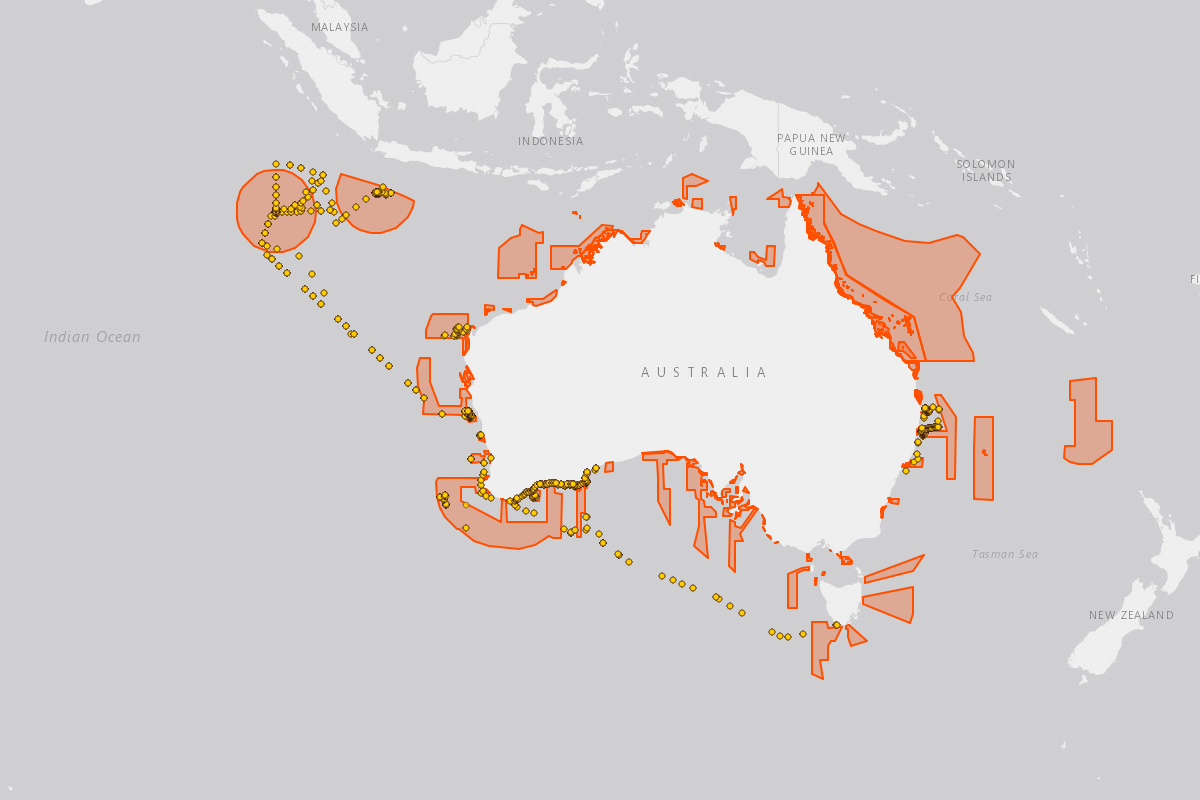
Explore

Biodiversity across Australia's national Marine Parks through the lens of environmental DNA

Explore by

The biodiversity in our oceans is difficult to monitor. From microbes to whale sharks, eDNA represents an alternate way to inventory life. Minderoo Foundation and Parks Australia teamed up between 2023 and 2025 to conduct the first ever eDNA baseline study of Australian Marine Parks. Below are different ways to explore the data.

BETA

This is a beta release — we are continuing to build and improve these tools.

Key statistics

More than 6000 samples collected over four years of dedicated eDNA sampling expeditions have characterised a vast amount of ocean biodiversity. What did we find:

We recovered over 1.2 billion DNA barcodes from seawater, 460,515 are unique.

We've identified 130,472 DNA barcodes from marine vertebrates. The vast majority, 126,873, are from bony fishes, while 2,168 are from sharks, rays, and chimaeras (cartilaginous fishes). The remaining 1,432 barcodes come from marine mammals, birds, and reptiles.

This represents > 25% of all the marine vertebrates that are known to call Australian waters home.

We detected 135 different kinds of cartilaginous fishes (sharks, rays, skates, and chimaeras) in our samples – from large ocean cruisers like the shortfin mako to deep-water bioluminescent species like the smooth lanternshark.

During 13 dedicated research voyages, 6000+ samples were collected across Australia – covering 4,000 km north to south and 6,000 km east to west.

Australia has ~5,000 described marine bony fish species. Through our eDNA surveys, we detected 2,576 different bony fishes, this represents more than half of Australia's known marine bony fish diversity!

We also identified 66,883 pieces of DNA we could not assign to any known species or even taxonomic order.

Some of the DNA barcodes that were detected don't match known vertebrate species references.

Instead, for these DNA sightings we can assign the family or other, higher-level labels.

What is eDNA?

Environmental DNA, or eDNA, refers to the traces of genetic material that all organisms leave behind in their environment through skin cells, scales, waste, mucus, or other biological matter. By filtering seawater, we can capture these fragments and analyse them in the lab to target specific sections of DNA that function like barcodes that are unique to each species. This allows us to non-invasively detect which organisms have recently been in the water, enabling detailed biodiversity assessments and improving our ability to monitor ecosystems.

eDNA data will change over time and that's a good thing

Environmental DNA (eDNA) is a dynamic tool, and its interpretive power evolves over time as reference databases and biodiversity classification schemes (taxonomy)s improve. One of the key reasons eDNA results can “change” is because taxonomy itself is not static — new species are continuously discovered, genetic relationships are revised, and classification systems are updated based on the latest science. As reference sequence databases like GenBank, BOLD, SILVA, and others expand or are refined, sequences that were previously unassignable or misclassified may later find confident matches. This means an eDNA dataset analyzed today might yield different results if re-analyzed months or years later using updated reference libraries. In this way, eDNA offers a kind of biological archive — samples can be revisited and reinterpreted as scientific knowledge progresses, making it a powerful long-term tool for biodiversity monitoring and discovery.

Analysed eDNA samples

This map shows the 6,000+ eDNA samples collected between 2021 and 2025 from coastal and offshore waters around Australia. These samples span dynamic tropical reefs in the top 50 metres, down to low-energy environments in the abyssal plains and deep-sea canyons. From tropical to temperate ecosystems our expeditions offer a broad snapshot of marine biodiversity. The shaded areas represent Australian Marine Parks (AMPs), which protect a variety of ecosystems across the continental shelf and deep ocean.

Stories

eDNA can tell us so much about biodiversity and the environment. Here are just some of the stories we have been able to tell using eDNA data from Australian waters.

Tree of life

We use trees of life as a visual representation of how living organisms are related. Check out the video below to see the tree of life from the results of sampling eDNA in the Cocos (Keeling) Islands.

Frequently asked questions

eDNA offers a non-invasive, cost-effective, and highly sensitive approach for detecting marine life. It can reveal the presence of rare, cryptic, deep-sea or hard-to-observe species without needing to catch or see them, making it a powerful complementary tool for biodiversity monitoring and conservation.

Yes and no. While there are correlations between eDNA signal strength and factors like biomass or abundance, standard eDNA approaches, (like broad scale metabarcoding) are not yet reliable for estimating exact numbers. However, some species-specific techniques, such as quantitative PCR (qPCR), can provide more precise estimates of abundance or biomass for target species.

Also, it can give us an idea on the relative proportion of the animals, for example, we can use eDNA to detect the seasonal changes in presence of a certain animal, or changes across an area. For example, inside and outside a marine park.

eDNA can detect a wide range of organisms, from microbes to large vertebrates, as long as their DNA is present in the environment and matches reference databases. The type of assay used will determine which groups of organisms are targeted for detection.

eDNA typically lasts from a few hours to a few days, and sometimes up to a week or more in colder, deeper, or darker waters. Despite this variability, from hours to a day, eDNA has been shown to provide highly accurate information at small spatial scales, making it a powerful tool for detecting which species have been in a specific area very recently. This sensitivity to time and space makes eDNA especially valuable for monitoring dynamic or hard-to-reach marine environments.

eDNA is generally considered a snapshot of recent biological activity, making it useful for detecting species that have been present in the area within the past few days.

Last updated: 23/07/2025

View release notes

Parks Tool

Explore by park

Every Australian Marine Park protects unique environments, ecosystems, and marine life. Use this tool to explore the Marine Park Networks and the regions surrounding each park and discover what eDNA can tell us about the remarkable biodiversity within these areas.

Australian Marine Parks play a vital role in protecting marine ecosystems, encompassing habitats from coral reefs to deep-sea canyons that support extraordinary biodiversity while offering opportunities for wildlife watching, diving, and fishing. Managed by Parks Australia, these 60 marine parks cover over 3.8 million square kilometres across Commonwealth waters, supporting local economies through tourism and fisheries while contributing to national food supplies. To better understand and protect the unique biodiversity within these vast areas, environmental DNA (eDNA) is being used as a powerful, non-invasive tool for monitoring species and tracking ecological change to inform marine park management.

Species Tool

Explore by species

This tool provides detailed insights into the presence and distribution of different species across the marine parks network. Use it to explore where and when different species have been detected.

Use the filters below to search by species group, species name, or detection date range to explore when and where species have been identified.

Exploration Tool

Explore the unknown

By focusing only on species sightings, we miss so much about every ecosystem. Here you can explore the dark diversity of eDNA we usually ignore!

eDNA data is powerful, but reference libraries are incomplete so we do not know from which species many pieces of DNA come from.

Every time we analyse environmental DNA (eDNA), we uncover a significant proportion of sequences that cannot be assigned to any known species — highlighting just how much of Earth's biodiversity remains undocumented. These “unknowns” arise primarily because reference databases are incomplete and biased toward well-studied organisms, often underrepresenting groups like microbes, invertebrates, and deep-sea life. These unassigned sequences could represent species that lack genetic reference material, or they could represent completely unrecognised diversity, even new species!

Despite these challenges, unassigned sequences offer valuable insights: they often represent real, yet-unidentified organisms and point to hidden biodiversity with potentially critical roles in ecosystem function. In this way, the unknown components of eDNA datasets not only underscore the limits of our current knowledge but also highlight the vast potential for discovery and ecological understanding.

To learn more about the 'unknown' or 'dark' diversity, OceanOmics has trained a DNA-based large-language model DNABERT-S with all metabarcoding data. We then clustered what the model has learned using a statistical method called tSNE.

Below you can explore the insight the model has created about the diversity of each unique piece of DNA. Check out the video to learn how it works!

Now it is your turn to have a go!

Click on a dot in the chart to explore the knowns and unknowns of the ocean!

How to use this chart

Last updated: 23/07/2025

View release notes

AI Tool

Chat with the data

Ever wanted to ask the ocean a question? Now you can… sort of. Use our AI-powered tool to ask anything you'd like of the data

This AI-powered tool lets you explore the eDNA data from our marine expeditions. It's the first tool of its kind to use artificial intelligence to interrogate eDNA data and generate biodiversity insights in real time. Just type in your question and let the model dive into the data for you. Here, we use Anthropic's Claude 3.7 Sonnet, a LLM that can write Python code in the background to answer your questions.

Whether you're curious about sharks, searching for the southernmost fish, or comparing biodiversity between regions, this tool helps turn complex genomic data into accessible insights.
Examples:
“Are there any sharks in the data?”
“What's the southernmost fish detected?”
“How many distinct species of fish were found in 2023?”

A few things to keep in mind:

  • Be patient. It might take a few moments to process your request; the tool is searching through billions of lines of eDNA data to find the answer.
  • Don't take the results at face value. Always verify independently.
  • Try rephrasing your question. You might get a better answer the second time.
  • Be specific. For example, asking about “sharks” might return different groups like Chondrichthyes, Elasmobranchii, or Carcharhiniformes.
  • Ask it to check itself. You can prompt it to explain or critique its own answer.

Ask me anything
Answer
The final answer appears here.
Bad question appears here

Last updated: 23/07/2025

View release notes

Contact

If you have any feedback or questions on the Marine Parks dashboard, please contact: oceanomics@minderoo.org.

Acknowledgements

Acknowledgement of Country

We respectfully acknowledge the Traditional Custodians of the Sea Country across all regions visited during our expeditions. We honour their enduring connection to the ocean and recognise the deep knowledge, care, and custodianship that First Nations peoples have sustained for millennia. We pay our respects to Elders past, present, and emerging, and extend that respect to all Aboriginal and Torres Strait Islander peoples.

We acknowledge that the waters, reefs, islands, and marine life we sampled and explored are part of living cultural landscapes. We are deeply grateful for the opportunity to conduct research on Country. In the spirit of reconciliation, we remain committed to listening to, learning from, and partnering with First Nations communities in our efforts to understand, protect, and conserve these vital ecosystems for future generations.

Community and Partners

This work was only possible with the support of community partners and collaborators across multiple regions, and we extend a heartfelt thanks to all of our collaborators on land whose support was instrumental to the success of this project. This includes the staff of DCCEEW and Parks Australia; the Shires of Christmas Island and Cocos (Keeling) Islands; Cocos Marine Care; Sea Country Solutions; the Yamatji Sea Rangers; and the Esperance Tjaltjraak Native Title Aboriginal Corporation.

Minderoo OceanOmics Centre at UWA

Minderoo OceanOmics Centre at the University of Western Australia brings together advanced molecular capabilities to support genomic research across marine systems. We sincerely acknowledge the OceanOmics Centre team for their unwavering dedication, perseverance, and outstanding efforts in processing complex samples to produce big data. Their technical leadership and commitment to delivering high-quality genomic outputs, is integral to our ability to translate raw expedition data into meaningful insights that advance our understanding of marine biodiversity.

Deep-Sea Research Centre at UWA

The Deep-Sea Research Centre is dedicated to expanding our understanding of the deep ocean by discovering new species, assessing marine biodiversity, mapping the ocean floor, and charting deep-sea habitats. We gratefully acknowledge the Deep-Sea Research Centre team for their exceptional expertise and commitment in facilitating sample collection during large-scale, logistically challenging deep-sea expeditions. We recognise the Centre’s capabilities, infrastructure, and support as critical to accessing the abyssal and hadal marine environments, contributing significantly to this research.

CSIRO National Biodiversity DNA Library (NBDL)

The CSIRO National Biodiversity DNA Library is an initiative to generate the comprehensive reference sequences needed to identify Australia’s biodiversity from DNA. The initiative is a collaboration between CSIRO, Australia’s research collections and a range of philanthropic and government agencies. The NBDL will generate data from expertly identified specimens held in Australia’s museums and herbaria, bringing new capability to biodiversity research, and enabling the uptake of new technologies to describe and detect changes in biodiversity from DNA that organisms leave behind in the environment. The NBDL will launch as a digital platform with its first available data in 2025. The findings presented here are powered by provisional reference data provided under a partnership with the CSIRO National Biodiversity DNA Library, for which we extend our thanks to NBDL collection partners and Bioplatforms Australia.

Technology partners
At sea operations

A big thanks to all the captains and dedicated crew from Pangaea Ocean Explorer, Immortalis and the R.V. Investigator. Your support, expertise, and seamanship made it possible for us to reach some of the most remote and pristine corners of the ocean - and to document the magnificent marine life that thrives there. We couldn’t have done it without you.

Illumina

We extend our deepest thanks to Illumina for their critical and ongoing collaboration. Their cutting-edge sequencing technology has been integral to the generation of all the genomic data featured in this project. From support for at-sea sequencing during expeditions to high-throughput operations at Minderoo OceanOmics Centre at UWA, Illumina’s collaboration and expertise have been indispensable to our efforts to accelerate marine biodiversity discovery and conservation.

Ocean Diagnostics

We gratefully acknowledge the team at Ocean Diagnostics for their collaboration, innovation, and steadfast support. Their instrumentation transformed the way we collect eDNA in the field, enabling efficient, high-quality sampling even in remote and logistically challenging environments. We’re especially thankful for their responsive technical support, which has been invaluable during fieldwork.

Wilderlab

We're grateful to Wilderlab for providing comprehensive tree-of-life eDNA data that extended far beyond our vertebrate focus. Their accessible visualisation tools help make complex biodiversity results easier to explore and interpret. We appreciate their ongoing support and collaboration in advancing the use of eDNA monitoring in our region.

Designed and developed by Epi

Thanks to Epi for their careful design and expert data science which has brought our complex, multi-million dollar DNA dataset to life. We couldn’t be more happy with the result — a collaborative process from Day one that has empowered both us, and end users, that visit this dashboard. We appreciate their ongoing support and collaboration in advancing the usability of eDNA data.

About

Environmental DNA (eDNA) data can be collected and generated in various ways, depending on the environment and research goals. In this project, seawater samples were collected using Niskin bottles mounted to CTD rosettes, benthic landers, or manual rope deployments, or via an in-situ filtration device, the Ocean Diagnostics Ascension. Seawater is pumped through fine mesh filter paper (typically 0.45–0.8 µm), from which DNA was extracted. The extracted DNA then undergoes eDNA metabarcoding, a method that amplifies and sequences short genetic markers from complex DNA mixtures to detect and identify marine organisms across a broad range of taxonomic groups.

By targeting multiple mitochondrial gene regions (such as 12S and 16S rRNA genes), we are able to get strong resolution across all marine vertebrate taxa. The resulting DNA sequences are processed through OceanOmics custom bioinformatic amplicon pipeline which includes demultiplexing, quality control steps and denoising via DADA2. The pipeline generates DNA barcodes that are assigned an identity, aiming for species-level discrimination. When a species-level label cannot be assigned with confidence, the DNA barcode is instead assigned at the appropriate genus, family or higher order taxonomic level in the biological hierarchy.

By doing this we can characterise marine vertebrate biodiversity from trace genetic material suspended in the water column. The pipeline is available on GitHub.

Primers used
Primer NamePrimerTarget geneSequence (5'-3')Length (bp)Amplicon length (bp)GC content (%)Annealing temp °CReference
16SFish16SF/D16S rRNAGACCCTATGGAGCTTTAGAC20178-2284554Berry et al. 2017
16S2R/D16S rRNACGCTGTTATCCCTADRGTAACT22178-2285054Deagle et al. 2007
MiFish-UMiFish-U-F12S rRNAGTCGGTAAAACTCGTGCCAGC21163–18557.160Miya et al. 2015
MiFish-U-R12S rRNACATAGTGGGGTATCTAATCCCAGTTTG27163–18544.460
MiFish-E2MiFish-E2-F12S rRNARGTTGGTAAATCTCGTGCCAGC22163-18552.460Miya M, Sado T, 2019a
MiFish-E2-R12S rRNAGCATAGTGGGGTATCTAATCCTAGTTTG28163-18542.960
MarVer1MarVer1-F12S rRNACGTGCCAGCCACCGCG16197-21281.354-56Valsecchi et al. 2020
MarVer1-R12S rRNAGGGTATCTAATCCYAGTTTG20197-21242.154-56

Release notes

23/07/2025

V 1.0.0 – initial release
  • Initial dashboard
  • Using first version of OceanOmics internal DNA database

Not found